Global Biodiversity Shiny dashboard for Poland
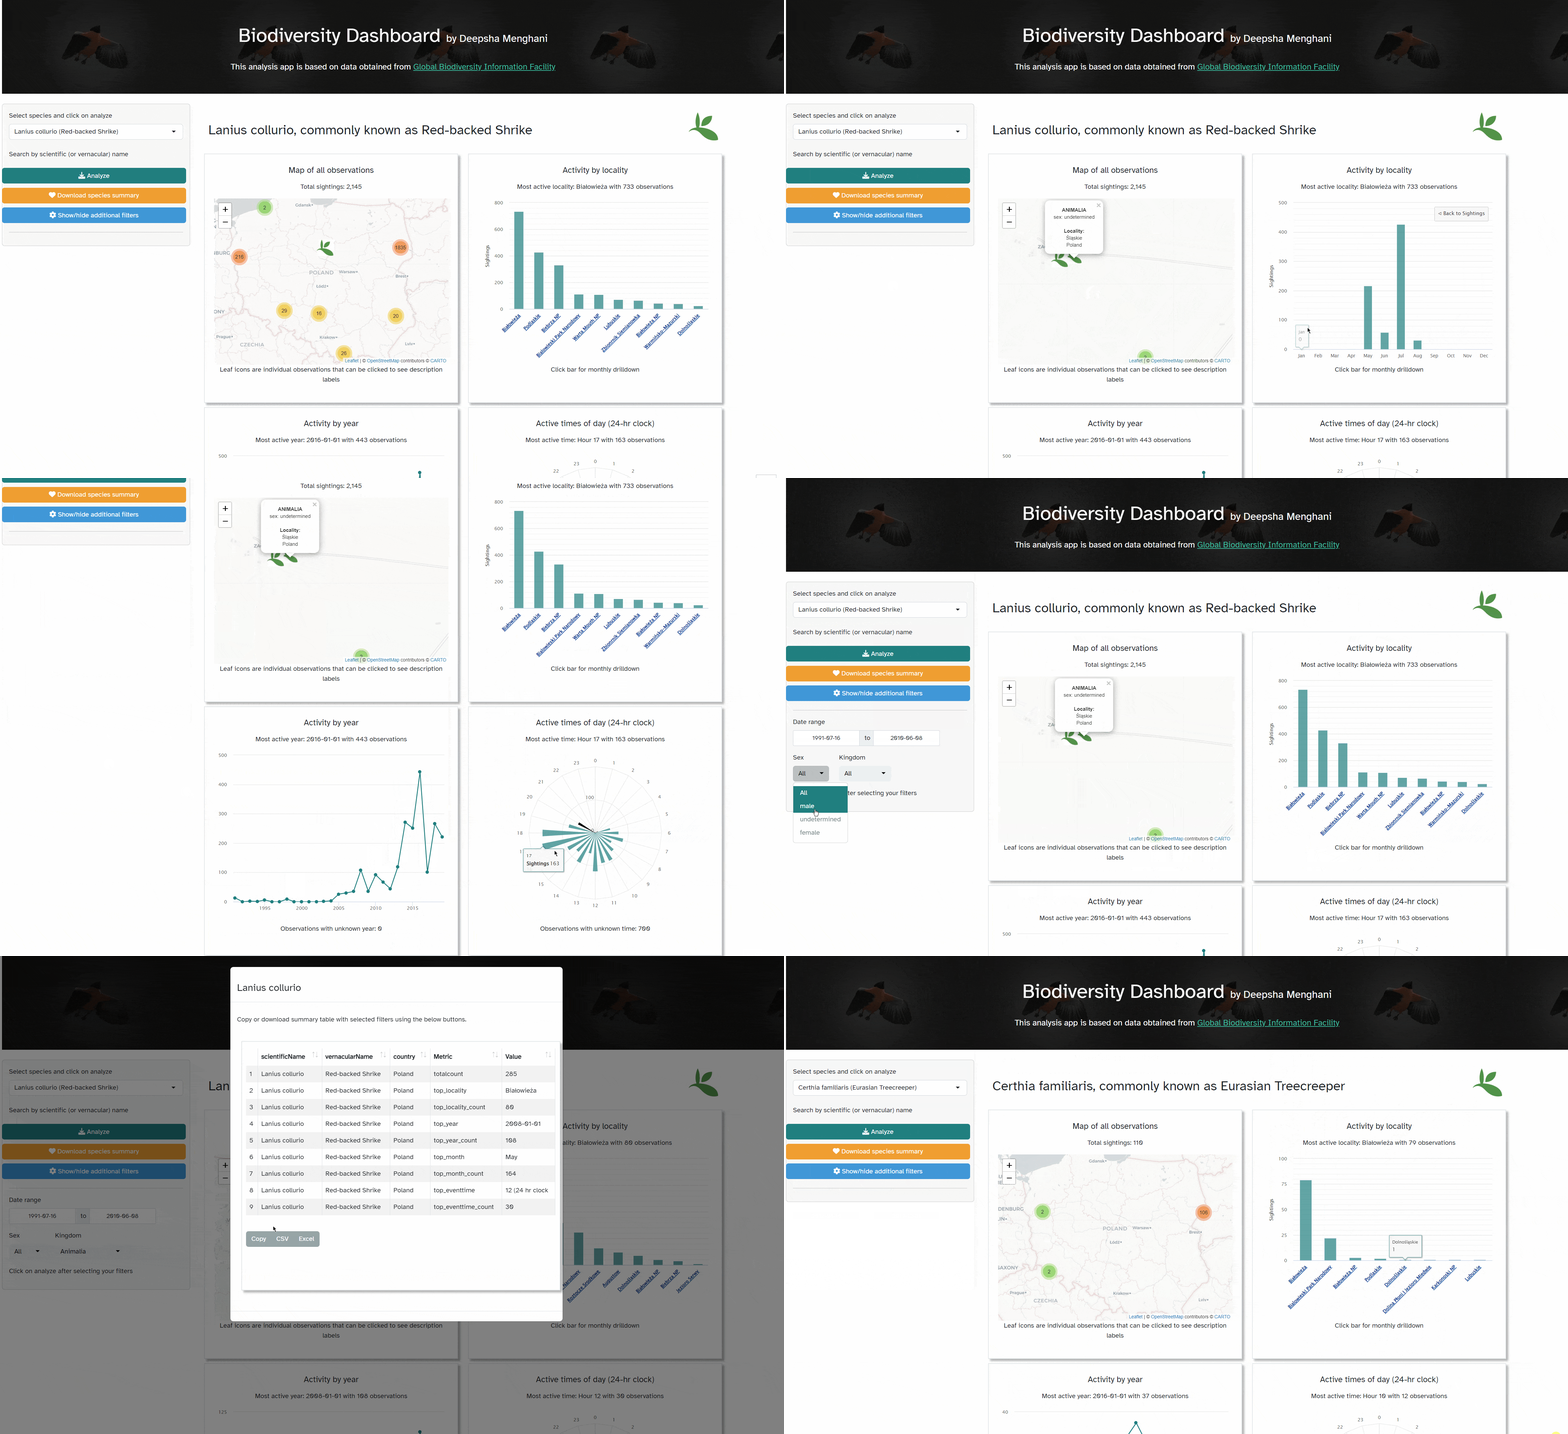
The GBIF Data Explorer is a web application that allows users to explore and analyze biodiversity data for Poland from the Global Biodiversity Information Facility (GBIF) database.
The app is built using the Shiny package for R. It includes several visualizations and filters created using the following packages: DT, shiny, shinyWidgets, shinythemes, shinyjs, bslib, bsicons, lubridate, leaflet, highcharter…. Check out the shiny dashboard

Collaborating between Python and R using Reticulate

Both R and Python are powerful data science languages and can be used to accomplish end-to-end analytics projects. Reticulate makes it easy to collaborate and talk between the two languages. I think of it as a translator on my fingertips.
My teammate and I participated in Microsoft hackathon where we accessed data from APIs using Python, pulled the output in R using Reticulate and created visualizations to derive business insights using Ggplot2… Check out how
Data visualizations - Animation and Interactivity using Gganimate and Plotly
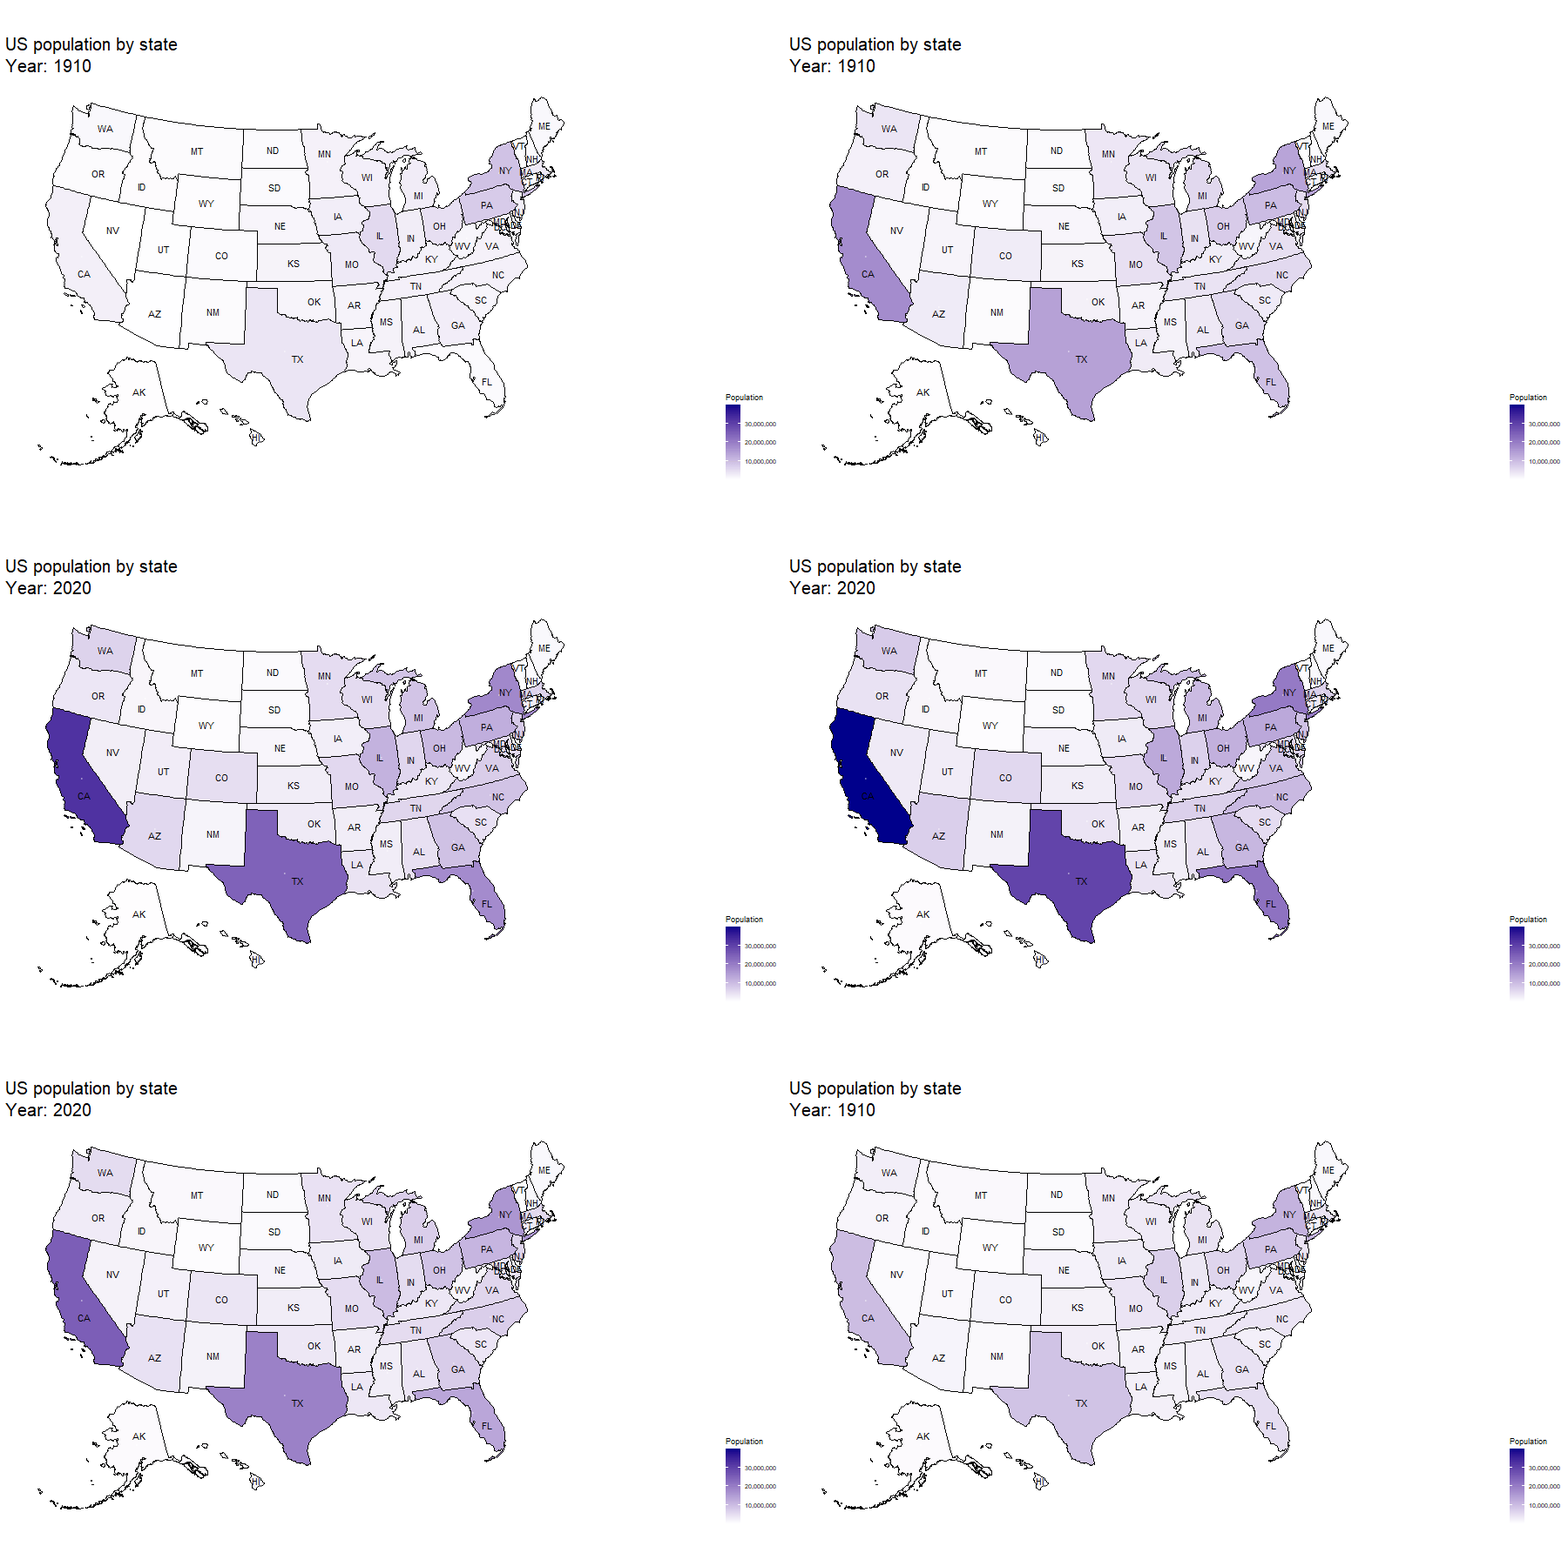
Animation brings in a key component of analysis where the third parameter you want to animate is not directly visible in your plot. Sometimes it can tell a powerful story and sometimes it can just add some flair to an otherwise low-key story.
This blog goes through examples and code to show how easy it is to use gganimate and plotly packages to animate your data visualizations and make them interactive…. Continue reading

Sales forecasting and anomaly detection Shiny dashboard

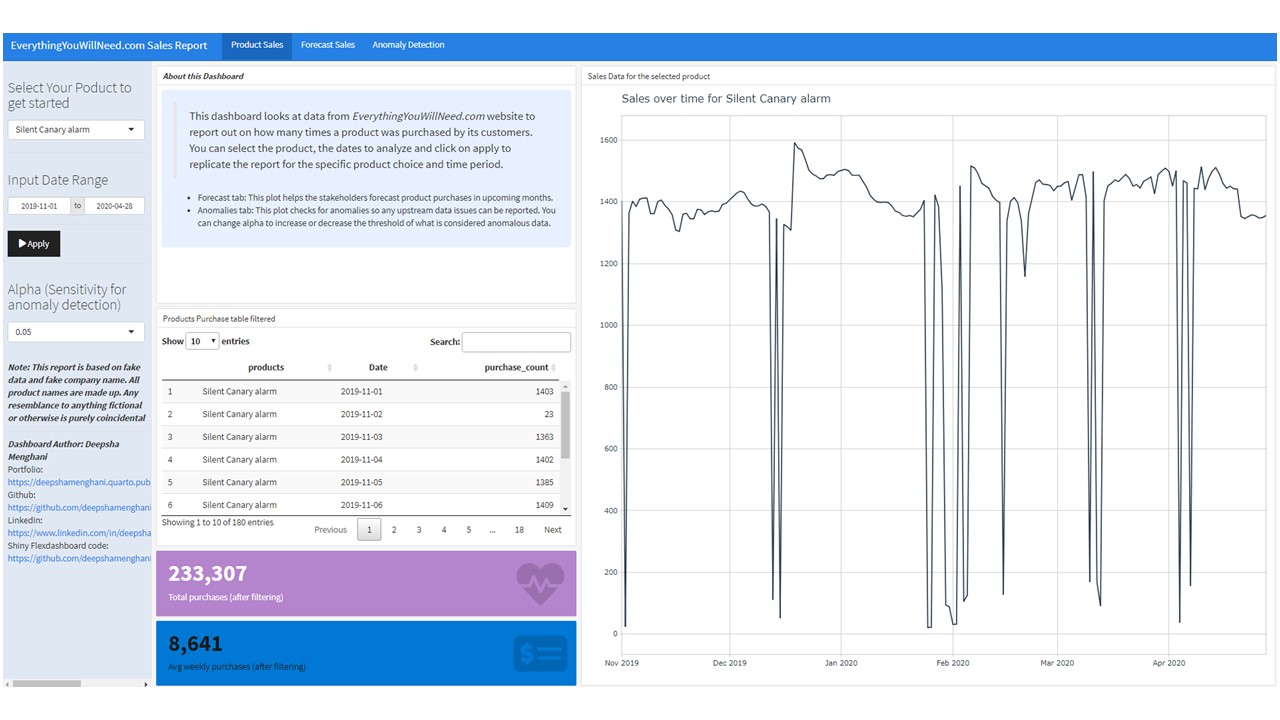
This dashboard, built with Shiny Flex capability, looks at data from EverythingYouWillNeed.com website (fake data) to report out odaily product sales. You can select the product, the dates to analyze and click on apply to replicate the report, check sales forecast and anomalies for the specific product choice.
Giving your stakeholders the ability to play with product grain forecast and anomaly detection is a great was to get them on-board prior to deploying any model at scale. This Shiny dashboard was built specifically for that purpose…. Link to play with the Shiny dashboard